If you’ve glanced at your energy bill recently and felt a creeping sense of bafflement, you’re not alone. The Ofgem energy price cap 2026 has been all over the news, but most of the coverage buries the actual numbers under layers of jargon. So here’s a straightforward breakdown of what the cap is, how it works, what it currently means for your annual bill, and why some parts of the country are paying noticeably more than others.
One quick note before we get into it: energy isn’t the only household cost that’s quietly climbing. Plenty of people are also spending more on routine home maintenance tasks. Things like wheelie bin cleaning have become popular as households try to stay on top of hygiene without racking up extra costs. But energy remains the big one. Let’s dig in.
What Is the Ofgem Price Cap and How Does It Actually Work?
The Ofgem price cap does not cap your total bill. That’s the single most common misunderstanding, and it trips up a huge number of people. What it actually caps is the unit rate you pay per kilowatt hour (kWh) of electricity or gas, plus the daily standing charge. So your final bill still depends on how much energy you use. Use more, pay more.
Ofgem reviews and resets the cap every quarter. That means January, April, July, and October each bring a potential change. The regulator bases the new figure on wholesale energy market prices, network costs, VAT, and operating costs for suppliers. When wholesale gas prices spike globally, the cap tends to follow upwards. When they ease, there’s usually a lag before consumers see any benefit.
The figures are expressed as an annual bill for a “typical” household. Ofgem defines that as a property using 2,700 kWh of electricity and 11,500 kWh of gas per year. Most people’s actual usage differs, sometimes significantly, but it gives a consistent yardstick for comparison.
What Are the Current Cap Figures for 2026?
For the April to June 2026 quarter, Ofgem set the price cap at £1,849 per year for a typical dual-fuel household on a standard variable tariff. That’s a modest decrease from the £1,938 figure that applied during the first quarter of 2026, reflecting a slight softening in wholesale markets over winter. However, it remains well above pre-crisis norms. Before the energy shock of 2021 and 2022, typical bills sat closer to £1,100 to £1,200 a year.
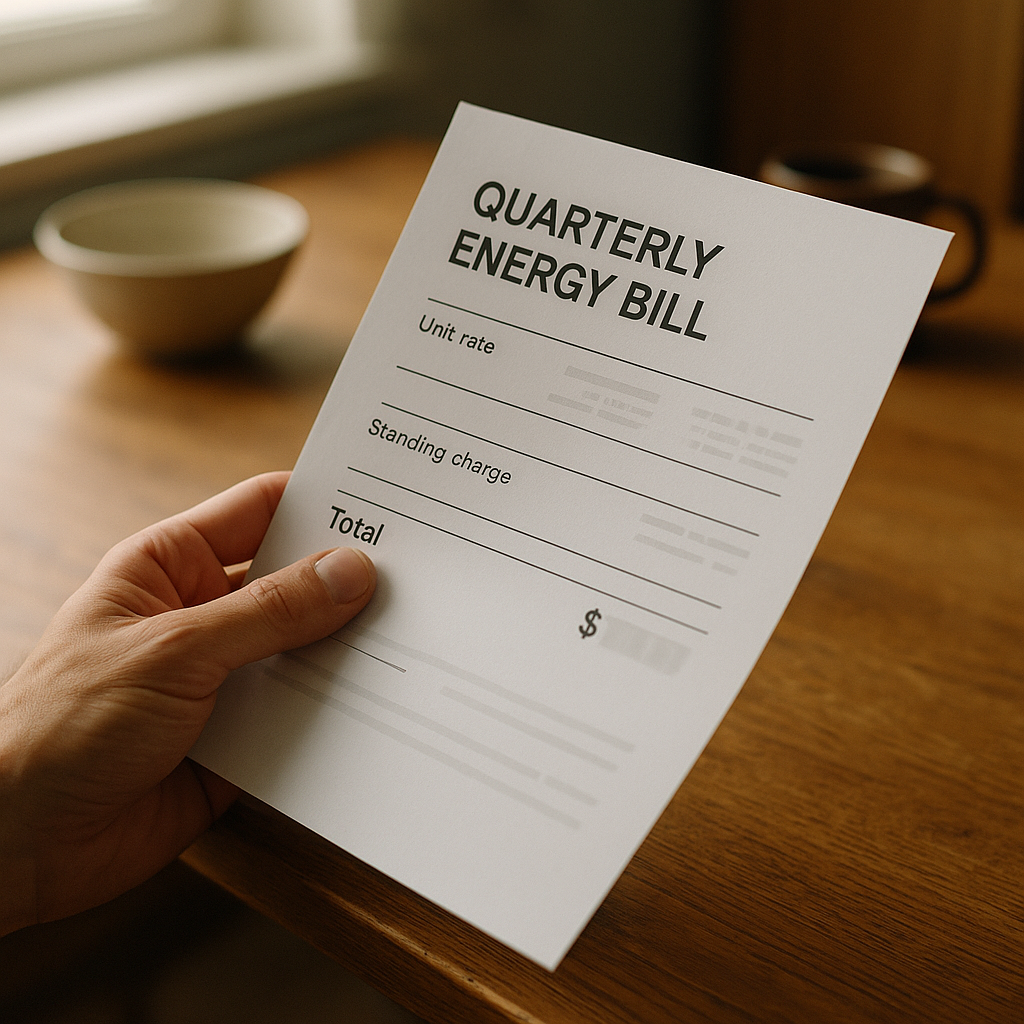
Breaking that down further: the capped electricity unit rate for Q2 2026 sits at roughly 24.5p per kWh, with a standing charge of around 61p per day. Gas comes in at approximately 6.4p per kWh, with a daily standing charge of about 31p. Those standing charges alone add up to nearly £340 a year before you’ve used a single unit of energy, which is a figure that catches many people off guard.
You can check the most up-to-date quarterly figures directly on the Ofgem website, where they also publish the methodology behind each adjustment.
Why Do Bills Vary So Much by Region?
This is where things get genuinely interesting. The Ofgem energy price cap 2026 is not a single flat number applied identically across Britain. There are fourteen distribution network operator (DNO) regions, and the standing charges in particular differ between them. Network costs vary depending on the age and density of the local grid infrastructure, how far energy needs to travel, and how much investment the local operator has had to make to maintain supply.
In practice, households in the South West of England and in parts of rural Scotland tend to face higher standing charges than those in London or the East Midlands. The gap can amount to £50 to £100 per year just from the standing charge difference alone, before usage even enters the picture. For households already stretched thin, that regional disparity feels deeply unfair, and it’s prompted ongoing calls for Ofgem to consider a national average standing charge instead of a regionally variable one.
Northern Ireland operates under a separate regulatory framework and is not covered by Ofgem. The Utility Regulator in Belfast handles price oversight there, and bills have historically tracked slightly differently to the rest of the UK.
Are Prepayment Meter Customers Still Paying More?
For most of the post-crisis period, prepayment meter (PPM) customers paid higher rates than those on direct debit. That injustice finally ended in July 2023 when Ofgem mandated parity, and it has held through into 2026. PPM customers now pay the same capped rates as everyone else on a standard variable tariff. That’s a significant improvement for around 7 million households who rely on a key or card meter, many of them in lower-income areas.
If you’re still unsure which tariff you’re on, your supplier’s app or online account will usually tell you clearly. And if a fixed tariff is available that undercuts the current cap, it’s worth at least running the numbers. Some suppliers have been offering 12-month fixes at rates below the Q2 2026 cap level, which gives a degree of certainty if you expect prices to rise again in the second half of the year.
Simple Ways to Cut Your Bill Without Losing Comfort
The price cap is what it is. Ofgem sets it and you can’t negotiate it down. But you can reduce how many units you burn through, which is where the real savings live.
Draught-proofing doors and windows is one of the highest return-on-investment jobs you can do in a British home, often costing under £50 in materials and saving multiples of that annually. Turning your boiler flow temperature down to around 55 to 60 degrees Celsius (if you have a modern condensing boiler) can cut gas consumption by up to 8%, according to the Energy Saving Trust. A smart meter won’t reduce your bills on its own, but seeing real-time consumption tends to change behaviour. And simple habits like only boiling as much water as you need, showering rather than bathing, and turning radiators off in unused rooms all chip away at that annual figure.
What Happens Next with the Cap?
Analysts are cautiously optimistic about the second half of 2026. Wholesale gas prices have eased compared to the peaks of 2022 and 2023, and forecasters at Cornwall Insight have projected the cap could dip slightly further for the July to September quarter, possibly towards the £1,800 mark, though nothing is guaranteed. Global events, from geopolitical tensions to extreme weather affecting LNG supplies, can shift wholesale prices sharply and quickly.
The longer-term picture involves a gradual shift towards domestic renewable generation, which should eventually reduce Britain’s exposure to volatile global gas markets. But that transition takes years, not months. For now, the Ofgem energy price cap 2026 remains the single most important number for household budgeting across the country, and staying on top of each quarterly change is simply good financial housekeeping.
Keep an eye on the quarterly announcements, compare fixed tariffs when they appear, and use your smart meter data if you have one. Knowledge, in this case, genuinely does translate to money saved.
Frequently Asked Questions
What is the Ofgem energy price cap for 2026?
For the April to June 2026 quarter, the Ofgem energy price cap is set at £1,849 per year for a typical dual-fuel household using 2,700 kWh of electricity and 11,500 kWh of gas annually. This figure is reviewed every quarter and can go up or down depending on wholesale market prices.
Does the Ofgem price cap mean I won't pay more than that amount?
No. The cap limits the unit rates and standing charges your supplier can charge, not your total bill. If you use more energy than the ‘typical’ household Ofgem uses as its benchmark, your bill will be higher than the headline cap figure.
Why are energy standing charges different in different parts of the UK?
Standing charges vary by region because they reflect the local distribution network’s costs, including grid maintenance, infrastructure investment, and the distance energy travels to reach homes. Rural areas and regions with older grid infrastructure, such as the South West and parts of Scotland, often face higher daily standing charges.
Do prepayment meter customers pay more than direct debit customers under the 2026 cap?
No, since July 2023 Ofgem has required that prepayment meter customers pay the same capped rates as those on direct debit standard variable tariffs. This parity remains in place through 2026, benefiting around 7 million households.
Is it worth fixing my energy tariff instead of staying on the price cap?
It depends on the fixed rate being offered and your view on where prices are heading. If a supplier offers a 12-month fix below the current quarterly cap, it can provide useful certainty. Compare deals on Ofgem-accredited comparison sites and check the cap forecast before committing.